Welcome to this tutorial. While writing this article, we assume that you already know what is Google Analytics 4.
Okay. let’s begin!
This is a step-by-step beginner's guide for tracking website traffic with Google Analytics 4.
Tracking website traffic sources is crucial for understanding how visitors find and interact with your website.
Google Analytics 4 (GA4) offers powerful tools for tracking these traffic sources.
Now, let’s go step-by-step into this article.
1. Pre-Tracking
We expect that you have already set up your Google Analytics 4 account.
If you haven’t done that, here is what you need to know:
Set Up A Google Analytics 4 Property
First thing first, what is a property in GA4?
Property in GA4 is a set of fields that you can use to store information about a specific object.
It’s similar to a key in a filing cabinet. it’s used to keep track of information about a specific object and helps to organize the data meaningfully.
This includes fields like "Name", "URL", "Category", "Number of Views," and more. Property is essential for understanding the behaviour of objects in GA4.
If you haven't already, create a GA4 property for your website.
Go to your Google Analytics account, click on "Admin," and then select "Create Property" under the appropriate account.
Then, follow the setup instructions provided.


Install The GA4 Tracking Code
Once your property is created, you'll be given a tracking code (G-XXXXXXXXXX). Add this code to your website's HTML, preferably in all pages' <head> section. This code allows GA4 to collect data from your website.
Enable Enhanced Measurement
In GA4, an "Enhanced Measurement" feature can help you track certain traffic sources more effectively. To enable it, go to your GA4 property and click on "Events" in the left-hand menu. Then, select "Enhanced Measurement." Toggle on the options you want, like "Scroll tracking," "Outbound clicks," and "Site search."
Set Up UTM Parameters
UTM parameters are tags added to your URLs that provide detailed information about the traffic source.
Click Here To Know About Landing Page SEO
Why To Use UTM Parameters?
UTM parameters allow you to see where they came from, what they did on your website, and which campaigns generated the most traffic. This data can then be used to optimize marketing campaigns and personalize your website.
You can create UTM parameters using Google's Campaign URL Builder tool.
Common UTM Parameters Include:
- Source (utm_source): The specific source of the traffic, such as "Google," "Facebook," or "newsletter."
- Medium (utm_medium): The marketing medium, like "organic," "cpc," or "email."
- Campaign (utm_campaign): The name of the campaign or promotion associated with the traffic.
- Content (utm_content): Specific information about the link or ad, especially useful for A/B testing.
When you create UTM parameters, make sure they are consistent and organized. This will help you analyze your traffic sources effectively in GA4.
Use Event Tracking
GA4 tracks events, which can include page views, clicks, downloads, and other user interactions. To track specific events related to traffic sources, you can set up custom events.
For example, if you want to track clicks on a specific ad banner, you can set up an event like "Banner Click" and trigger it when someone clicks on it.
You can then use UTM parameters to provide additional context about the source of that click.
2. How To View Traffic Sources On Google Analytics 4?
And the basic setup is completed. Now, you may be wondering how you can see the sources of the traffic.
But we take through the acquisition dashboard, we want to explain some important terms:
- Users - The number of people that are active.
- Sessions - A session is active when users open an app, web page, or screen. So, here you get the data of the number of active or opened sessions.
- Engaged Sessions - The count of sessions that either extended beyond 10 seconds, included a conversion event, or featured at least two screen or page views.
- Average engagement time per session - The length of time a user remains engaged during each session.
- Engaged session per user - The calculation of engaged sessions per user, expressed as the ratio of engaged sessions to the total number of users.
- Events per session - Here, you obtain the mean count of events occurring in each session.
- Engagement rate - The proportion of engaged sessions, calculated by dividing engaged sessions by the total number of sessions and expressed as a percentage.
- Event count - The total number of times people initiated an event.
- Conversions - Its count of instances where your users initiated a conversion event. For additional information, please refer to...
- Total revenue - The total income generated from purchases, subscriptions, and advertising is calculated by adding the revenue from purchases, subscription fees, and ad revenue together.
Simply Open Your Google Analytics 4 Account And Click On ‘Reports’.

Now, Click On The ‘Acquisitions’.

Here, you have 3 options to choose from:
1. Overview
The Acquisition Overview report in GA4 summarizes how users are finding and arriving at your website. It offers insights into various acquisition channels and their respective performance metrics.

Example: Suppose you're running a multi-channel marketing campaign encompassing Google Ads, organic search, and social media advertising.
In the Acquisition Overview report, you'll see a breakdown of users acquired from different countries. Plus, the following:
(i) The First User Default Channel Group
Here, you get to know the channel through which the user was first acquired. A default channel group categorizes traffic sources based on rule-based definitions.
(ii) Session Default Channel Group
In the default channel group, the user's session was referred to. Your traffic sources are defined by channel groups based on rules. The default system definitions reflect Analytics' current understanding of each channel.
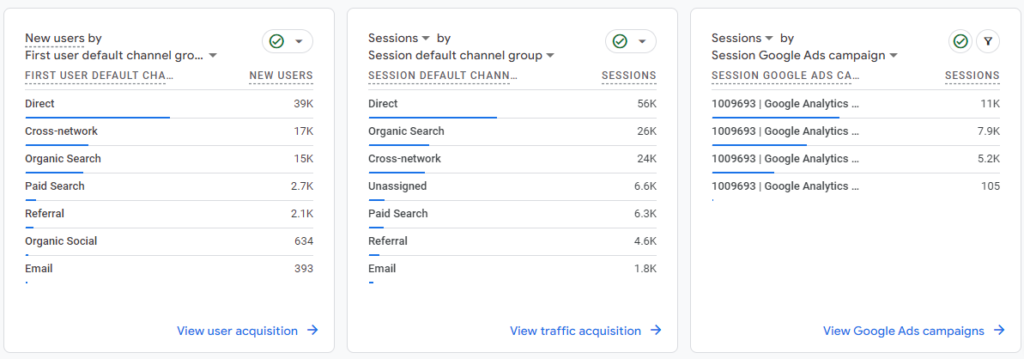
(iii) Session Google Ads campaign
This is the name of the Google Ads campaign that acquired the user most recently.
2. User Acquisition (Solely Reflects Data Of New Users)
The User Acquisition report in GA4 delves deeper into the specifics of user acquisition. It provides detailed information about new users and their behaviour on your site.
Example: Suppose you've recently launched a new product line. With the User Acquisition report, you can track how many new users have visited your website due to this launch. You can also observe their engagement patterns, such as which pages they visited, how long they stayed, and whether they converted into customers.


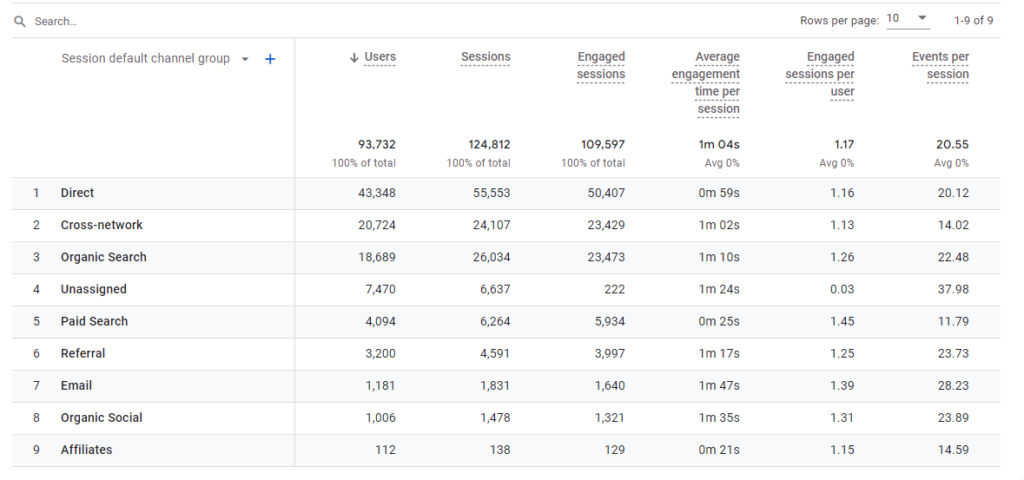
3. Traffic Acquisition (The One You Need To Consider Here)
The Traffic Acquisition report in Google Analytics 4 focuses on the various sources that drive traffic to your website. It categorizes these sources into channels, providing detailed metrics for each.
Example: Consider a scenario where your website receives traffic from multiple sources like direct, organic search, referral, and paid search. The Traffic Acquisition report breaks down the traffic from each of these channels.

For Instance, It Tells You:
- How many users came directly to your site?
- The number of users arrived through search engines.
- People who were referred from other websites.
- Specific count that came from paid search campaigns (like Google Ads).
Guess what? Traffic acquisition is the report type that gives you details of the sources of the traffic.
Improve Your Traffic - Analyze Traffic Sources In Google Analytics 4
Now you have an idea of how to check the traffic sources on Google Analytics 4.
What’s next?
It’s time to analyze your traffic.
Now, What Exactly We Mean Is:
- Analyze the traffic sources and identify the most-performing and the worst-performing channels.
- Evaluate the metrics. Suppose you find out the engagement rate is lower. Discover what leads to a lower engagement rate.
Once you thoroughly analyze your strengths and weaknesses, you will be more likely to make informed decisions.
Bottom Line
With the data that comes from Google Analytics 4, you can tweak your strategies related to:
- Content
- Design
- Preferred channel
- Target location
- Most importantly, the overall user experience
Bring the changes into action. The overall effect of these developments is amazing. It can boost your traffic up to 10 times.
That’s all. We hope that you understand the steps involved in it. If you have any doubts, feel free to reach out to us.
Read Also: