Millions of people skyrocketed their businesses with Google Analytics. Are you next?
Google Analytics provides valuable data to track website performance, measure customer engagement, and see what content drives your site traffic.
It offers a powerful and robust application that lets websites gain insight into how their visitors engage with the site. In addition, this free tool makes it easy to track and analyze important data.
Google Analytics offers dozens of reports, from simple to more complex. This guide provides an overview of the reports that beginners should use to get started and a step-by-step guide for installing Google Analytics on your website.
But, with so many features, it cannot be easy to know where to start.
Do you need clarification about how to use Google Analytics for your business? This article should be your reference point. So without further ado, let's get started.
What Is Google Analytics?

Google Analytics is a free web analytics service offered by Google that tracks and reports website traffic. It allows users to track visitors from all referrers, including search engines, display advertising, and pay-per-click networks.
Analytics provides an understanding of customers' online journey to complete a goal. It also provides insight into the performance of marketing campaigns and website strategies. You can also use this data to improve website design, usability, and user experience.
When it comes to Google Analytics, you should consider - Universal Analytics and GA4.
(i) Universal Analytics
Universal Google Analytics is a web analytics tool offered by Google. It is a service that allows website owners to track and analyze their performance. Universal Google Analytics uses code snippets placed on your website to track user actions and behavior, generate reports, and provide insights into how visitors interact with your site.
Universal Google Analytics enables website owners to track visitor activities, including page views, time on page, bounce rate, transactions, and conversions. It also provides data on the geographic location of visitors, their device type, and the source of their traffic.
Additionally, Universal Google Analytics can be used to track events such as video views and downloads.
It also offers insight into how visitors interact with your website, allowing you to identify areas of improvement. We can use this data to adjust marketing campaigns, optimize website design, and improve user experience.
The easy operability makes Universal Google Analytics the most sought-after web analytics tool. It is also free, which makes it an attractive option for small businesses and startups.
(ii) GA4

GA4 Google Analytics is the latest version of Google Analytics. It was released in October 2020 to give users a more comprehensive view of their website's performance.
GA4 Google Analytics offers new features such as enhanced data collection, an improved user interface, a greater focus on customer journey analysis, and improved privacy features.
With GA4 Google Analytics, users can collect data more comprehensively. This includes the ability to track user events and engagement across multiple devices, as well as the ability to measure the effectiveness of content and advertising.
Additionally, the new version of Google Analytics makes it easier to analyze customer journey data and understand how users interact with a website.
The new version of Google Analytics also provides a more user-friendly interface, making it seamless for users to find the information they need. Additionally, it offers improved privacy features, allowing users to control the data that is being collected about them.
GA4 Google Analytics is a powerful tool for website owners and marketers. It provides more detailed insights into user behavior and allows users to understand their website's performance.
Benefits Of Google Analytics

Advanced analytical features let segregate users based on specific criteria. That, in turn, helps better understand their behavior.
Starting from analyzing your website traffic to creating custom reports, Google Analytics helps you in multiple ways.
(i) Track Website Traffic
Google Analytics provides detailed statistics and analysis of your website traffic. It helps you-
- Measure your website's performance.
- Identify your site's strengths and weaknesses.
- Optimize for better results.
- This can help you determine what content is most popular with your users.
- You can Identify source traffic and the most successful channels.
(ii) Monitor Website Performance
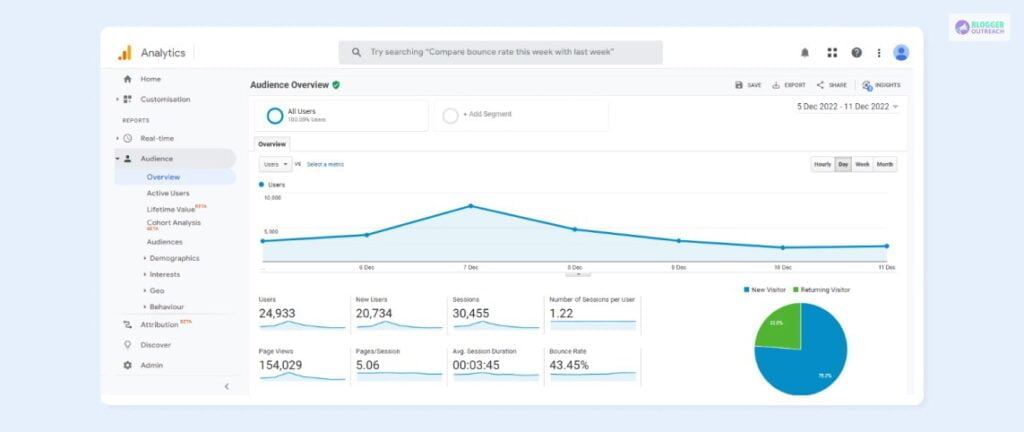
Google Analytics provides detailed reports on page speed, page views, and bounce rates. These metrics can help you identify areas of improvement for your website. It also allows you to compare your website performance to that of your competitors easily.
(iii) Identify Traffic Sources
Google Analytics tracks and reports on traffic sources, including organic search, direct visits, referrals, and paid campaigns. This data can help you understand how users are coming to your website and how to optimize your marketing efforts.
(iv) Monitor User Engagement
Google Analytics tracks user engagement metrics like pages per session, bounce rate, and time on site. This data can help you understand how engaged your users are and how to improve their experience.
(v) Monitor Conversion Rates
Google Analytics helps you track and analyze conversion rates. This data can help you understand how successful your marketing campaigns are and identify areas for improvement.
(vi) Generate Custom Reports
Using the most relevant metrics, Google Analytics aids you in generating custom reports.
(vii) Real-Time Data
Google Analytics tracks and measures website activity in real-time. This feature gives you a better understanding of how users engage with your website, helping you make decisions to improve performance.
(viii) Audience Insights
Google Analytics provides insights about your website’s visitors, such as their location, device type, browser, and more. This information helps you better target your audience and understand how to optimize your website for the highest engagement.
(ix) Acquisition Reports
Google Analytics’ acquisition reports let you track how users come to your website from different channels, such as organic search, social media, and email campaigns. This information helps you understand which channels are performing the best and where you should allocate more resources.
(x) Conversion Tracking
With Google Analytics, you can track user actions that indicate a purchase or other desired behavior. This helps you measure the success of various marketing initiatives, such as email campaigns or paid searches.
(xi) Custom Reporting
Google Analytics allows you to create custom reports that provide insights about user behavior and website performance. This makes it easier to analyze data and identify areas of improvement.
Click Here To Read Out: 20 Best Marketing Podcasts To Listen To In 2023
Google Analytics Hierarchy

Google Analytics Hierarchy is a set of organizational structures that help to organize the data collected in Google Analytics. It sails through five levels of hierarchy: Organization, Accounts, Property, View, and User.
(i) Organization
Organizations are the highest level and represent a company - like our own BloggerOutrach. Having an organization is a great idea for larger businesses as it encompasses multiple GA accounts. But if you're a smaller firm, an organization is optional.
(ii) Accounts
Your account is the key to unlocking all the amazing insights Analytics offers. First, you can create one or more Analytics accounts to track the progress of different properties. Then, manage the relationship between accounts and properties using a one-to-one or one-to-many approach - the power is in your hands!
(iii) Properties
A property can be a:
- Website.
- Mobile application or device.
Properties are touchpoints from where you organize the data. You can track data from one or more properties with a single account. Get started now and unlock valuable insights with Analytics!
Create an Analytics account and add the properties you want to collect data from. Analytics will generate a tracking code with a unique ID that identifies the data from each property and makes it easily identifiable in your reports. Additionally, Analytics creates one unfiltered view for each property you add.
(iv) Views
Have you ever wanted to have a deeper insight into your data? With views, you can do just that! You can consider views as your access point for reports and a defined view of data from a property.
You give users access to a view to see reports based on that view's data. Plus, with just one property, you can have multiple views - like one view of AdWords traffic and another of a subdomain!
While adding a property to an account, Analytics will create the first view for that property. This view includes all the data for the property, so it's important to leave it unfiltered.
Of course, you can always create additional views and apply filters to them, so they each include the specific subset of data you need.
(v) Users And Permissions
Google Analytics enables you to grant permission to persons to perform administrative tasks. You can also restrict any user if you feel like doing so.
Google Analytics Basic Terminologies
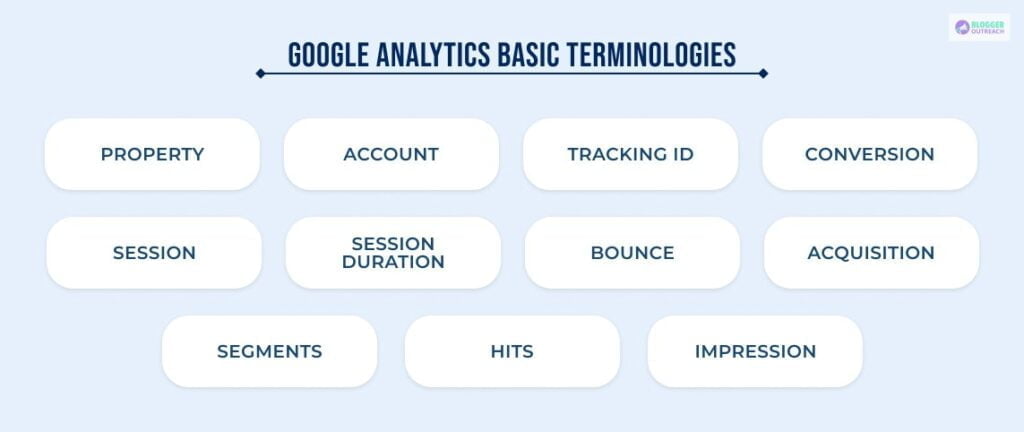
Before diving into the complexities of Google analytics, we want you to know the basic terminologies of Google Analytics.
Property: The landscape that you want to monitor is your property. Example: website, apps, etc.
Account: It is an umbrella term encompassing all the properties.
Tracking Id: An unique code that Google uses to fetch information from your website or app.
Conversion: It measures when your prospects take any action. To be precise, it symbolizes converting your prospects into your customers.
Session: A session is a series of activities within a given period. A Session on your website is a period that a User is actively engaged. Thirty minutes of inactivity leads to the end of a session.
Session Duration: It tells you how much time your audience has spent with your website.
Bounce: You can identify the less interested users with the help of bounce. Bounce tells you the number of users who leaves your site from visiting a single page only.
Acquisition: It enables you to know the source of your traffic. Acquisition reports aid you in understanding how people find your website.
Segments: It helps to categorize your data and filter out the data according to your need.
Hits: They are something that Google can track. Example: page view, form fillup, clicking a link, etc.
Impression: It indicates ad frequency and the number of times people have seen your ad.
Setting Up Google Analytics
Google Analytics is a powerful and popular web analytics tool used by website owners to track and analyze website traffic. Setting up Google Analytics is a simple process and requires a few steps.
Step 1: Set Up Google Tag Manager
- To get started with Google Tag Manager, first create your account.
- Then, create a container for your website. The container is unique to your website and where you'll install Google Tag Manager.
- For easy identification later, use your website URL or domain as the Container name. With this, all data from your website can be collected and sent to Google Analytics.
Step 2: Sign Up For Google Analytics
To get started, you must sign up for a Google Analytics account. You must have a Google account, such as a Gmail account, to execute the same.
- Go to google.com/analytics.
- Click the "Sign Up" button.
- Enter your account information.
- Select an account type (if applicable).
- Agree to the Google Analytics Terms of Service.
- Click "Create Account" to finish.
Step 3: Add Google Tag Manager To Your Analytics Tracking
- Go to your Google Tag Manager dashboard.
- Click on the Add a new tag button.
- Now, you’ll land on a page where you can design your new website tag.
- On this page, you can customize two aspects of your tag.
- Configuration - which will determine the destination of the collected data.
- Triggering - which will determine what type of data you want to collect.
- To create a tag for Google Analytics, click the Tag Configuration button and select the “Universal Analytics” option.
- After that, you’ll be able to choose the type of data you want to track.
- Next, go to the “Google Analytics Setting” page and choose “New Variable…” from the dropdown menu.
- A new window will open where you can enter your Google Analytics tracking ID. This will send your website’s data straight into Google Analytics so you can view it later.
- Next, go to the “Triggering” section to select the data you want to send to Google Analytics.
- Click on the Triggering button to visit the ‘Choose a trigger’ page and click on “All pages” to send data from all your web pages.
- Finally, click on Save, and your new Google Tag will be set up and sending data to your Google Analytics page!
Step 4: Generate The Tracking Code
After adding your website, you must generate the tracking code. This tracking code is a snippet of code that needs to be added to your website to track and analyze your website traffic.
- Log into your Google Analytics account.
- Click “Admin” at the top of the page.
- In the middle column, select the “Property” you want to track.
- Click “Tracking Info” at the bottom left of the page.
- Select “Tracking Code”.
- Copy the entire tracking code and paste it into your website's <head> section.
Step 5: Add The Tracking Code To Your Website
Once you have generated the tracking code, you must add it to your website. You should add a tracking code to every website page you want to track. You can either add the code to your website's header or footer, or you can use a plugin to add the code to your website.
Step 6: Set Up Goals
Google Analytics enables you to set up goals to track your website's performance. Goals can be anything from newsletter subscriptions to product purchases. Setting goals is important to measure your website's and marketing campaigns' success.
Google Analytics Interface Walkthrough
At this point, you get an idea about the basic principles of Google Analytics. Let’s give your a tour of the Google Analytics interface.
(i) Accessing Google Analytics
There are two ways you can access Google Analytics.
- Visit http://www.google.com/analytics and sign into your account and select Analytics.
- This is another way for those already linked to the account. Go to your Google Ads account, click on tools, and then click measurements.
(ii) Choosing The Account
- Once you land on Google Analytics, you must select the account you want to examine. Navigate to the "All Accounts" menu from the top left of your page.
- Once you click the “All Accounts” menu, you will see another submenu - “Properties & Apps.” From this submenu, choose the website you want to manage.

(iii) Landing On The Dashboard
Upon completion, you will visit the website's Google Analytics dashboard, which displays key information such as User count, conversions, and Engagement time. You can click on the other tabs from there to get an in-depth view of your website's performance.

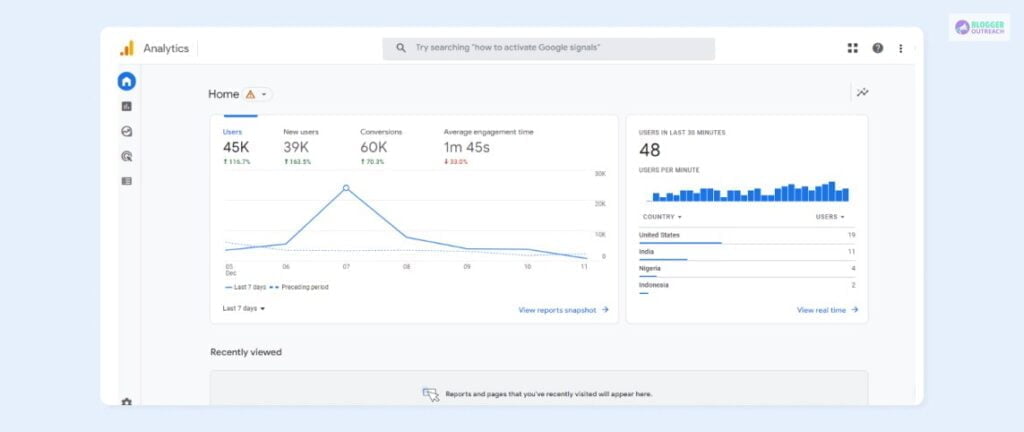
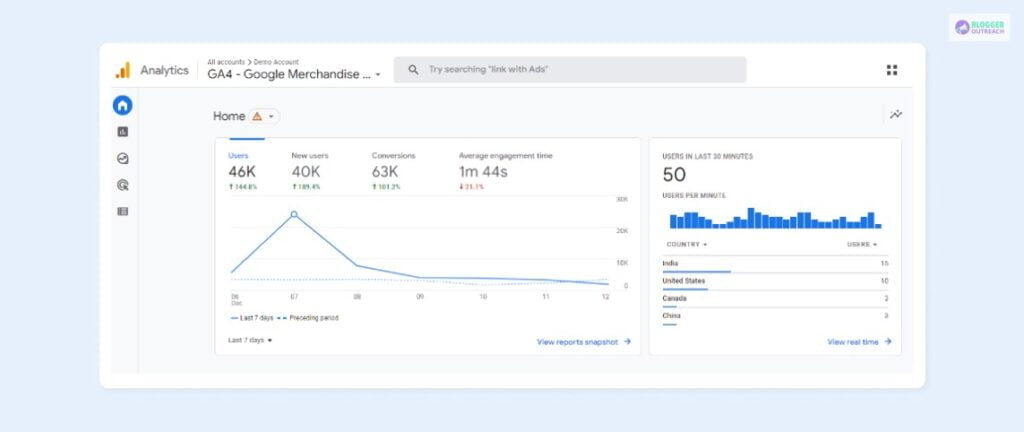
(iv) Home Page
Google Analytics Home page is the best place to get a quick overview of your site's data.
The main graph on the page displays the Total Users and New Users over the last 7 days, Total Revenue, Average Engagement Time, and Timeline of user visits.
There's also a Users in Last 30 Minutes graph that shows the Total Number of users in the last 30 minutes, a bar graph with user visit counts for each minute and countries from where they belong.
On the right-hand side of the Home page, there's a Recently Viewed section that allows you to quickly access other pages that you may have looked at minutes ago.
Google Analytics Navigation Menus
The Google Analytics interface has a navigation menu on the left side with the following options:
Home: Displays a quick overview of visitors in the last 30 minutes and several trends based on time.
Reports: Offers detailed analytics, categorized into Real-Time, Audience, Acquisition, Behavior, and Conversions.
Explore: Uncovers important trends through custom or templated tables and charts.
Advertising: Connects to Google advertising campaigns and shows their analytics.
Configure: Useful for experienced users to configure Google Analytics data, with tools to manage Conversions, Audiences, Events, and more.

Google Analytics Dimensions And Metrics
Dimensions are the attributes that describe any segment or help you to arrange the data. They are descriptive, and you can not quantitatively measure dimensions. Common examples of dimension are-
- Campaign
- Country
- City
- Age
- Gender, etc
In comparison, you can quantify the value of metrics. Metrics are the qualitative value that helps you to track your campaign through Google Analytics.
Examples To Understand Dimensions And Metrics:
Example #1 - Let us understand this with the help of an example. Suppose you’re tracking country-wise population through your campaign. Here countries are dimensions, and the population is metrics.
| Dimension | Metric |
| Country | Population |
| US | 331.9 million |
| UK | 67.33 million |
Example #2 - Imagine you’re gauging the gender-wise clickthrough rates (CTR) for a specific campaign. Here genders are dimensions, and click-through rates are metrics.
| Dimension | Metric |
| Gender | CTR (%) |
| Male | 3.2% |
| Female | 1.2% |
Pros Of Using Google Analytics
It is a comprehensive tool with multiple benefits. Here are some of them-
Comprehensive Data: Google Analytics is a comprehensive tool for collecting and analyzing data. It provides a detailed view of website visitor behavior, including pageviews, time on page, bounce rate, and more. This allows marketers to understand their website performance better and make data-driven decisions.
Easy To Use: Google Analytics is easy to set up and use. It has a simple dashboard with straightforward navigation and reporting tools. It also allows users to customize their reports and view data in various ways, including graphs and tables.
Customization: Google Analytics will enable users to customize their reports and view data in multiple ways. This makes it easy to track and analyze specific metrics, such as bounce rate, conversion rate, and time on page. Segmenting data by geographic location, device type, and other criteria is also possible.
Integration With Other Google Products: The perk of using Google Analytics is that it is integrated with other products, such as AdWords and Google Tag Manager. This makes it easy to track and analyze data from multiple sources, such as search engine optimization (SEO) campaigns, online advertising, and social media campaigns.
Actionable Insights: Google Analytics provides actionable insights to improve website performance. It allows marketers to identify areas of weakness.
Cons Of Using Google Analytics
Among the benefits, some challenges come with Google Analytics. They are-
Data Retention Policies: Google Analytics has a specific data retention policy that restricts the time you can retain data. This can be frustrating if you want to keep a certain amount of data on hand or if you need to access data from past campaigns.
Cost: Although it offers a free version for businesses with higher traffic, that is irrelevant. If you need more detailed and customized reporting, you will need to upgrade to the premium version. This can be costly for small businesses, requiring more money to upgrade.
Data Accuracy: As with any data, there is the potential for errors in the information collected by Google Analytics. This could be due to sampling, incorrect data tracking, or other issues. Therefore, it is important to review the data collected to ensure it is accurate.
Data Limitations: Google Analytics is limited in tracking user behavior. It cannot track individual user actions or determine the context behind an action.
User Reviews: Google Analytics
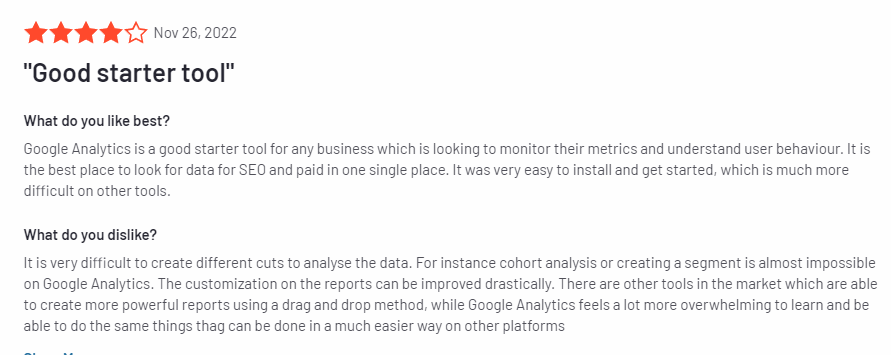
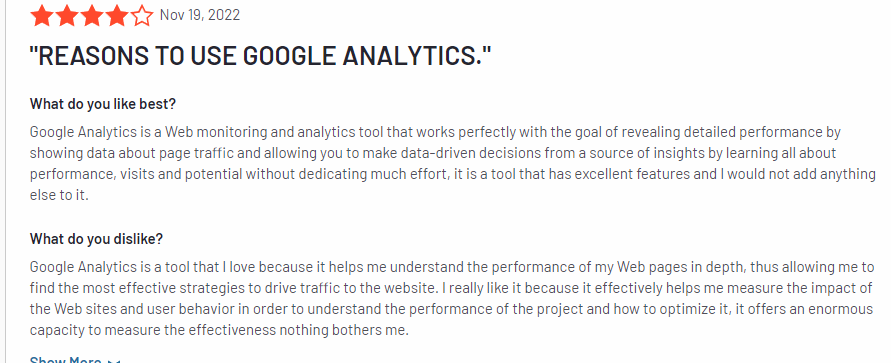
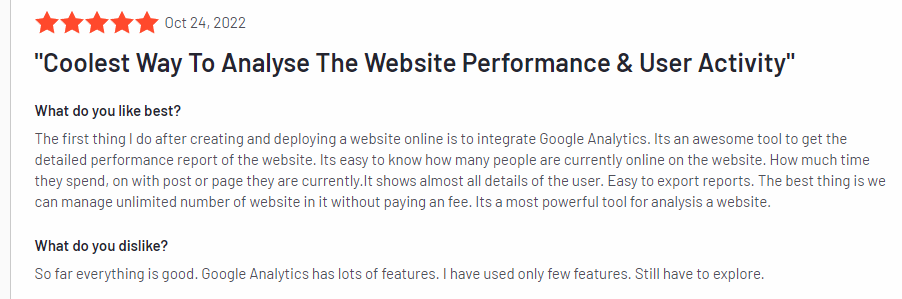
If You Want To See More Customer Reviews, Click Here.
Ready To Start With Google Analytics?
Google Analytics is invaluable for businesses, marketers, and website owners. It provides an easy-to-use platform to measure and track website performance, allowing users to make informed decisions on optimizing their sites.
With the help of Google Analytics, users can gain insight into their audience, track conversions, and understand their website visitors' behavior.
Google Analytics involves a high learning curve and difficulty understanding some of its more advanced features.
Nevertheless, with the right approach, you can learn how to use Google Analytics and take advantage of its many features.
Read More: